Machine Learning with Python
In the next series of tutorials we will begin to develop more complex analysis on the back-end server while visualizing the results using the analysis overlay grid we developed in the last set of tutorials. For this analysis we will explore the methods of Machine Learning, which will allow us to model complex systems within our data, and use those models to make predictions. To run Machine Learning algorithms on our back-end server, we will use the scikit-learn library for Python, which contains many useful Machine Learning algorithms, while being extremely easy to use and learn.
Setting up scikit-learn
Like pyorient and Flask, scikit-learn is an external Python library, so before we start to use it we need to install it into our Python distribution. Also like Flask, scikit-learn is available directly from Canopy’s Package Manager. To install it, go to Canopy’s Package Manager (make sure you are logged in with your Academic account) and type ‘scikit’ into the search bar.
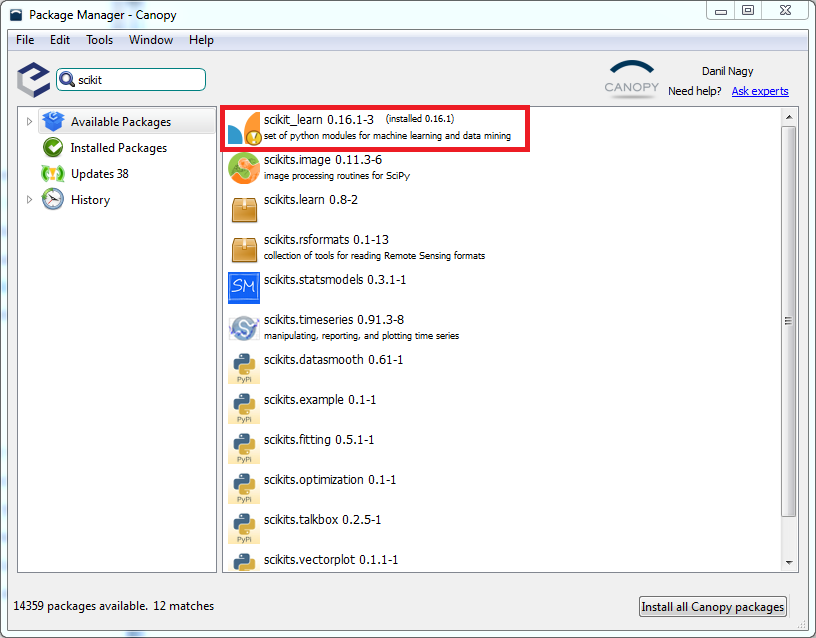
The first result should be ‘scikit_learn’ followed by the version number. Select this result and click the ‘Install’ button to install it. Once the installation completes you can go to the Python interpreter and type in:
import sklearn
If you don’t get an error the installation was successful and we are ready to go. To get a feel for the library and learn some of the basic principles of Machine Learning, I suggest you go through the Quick Start Guide as well as some of the tutorials on the scikit-learn website. The library also comes with some basic example datasets, along with some example projects which you can follow to get practice with using the library and see some real-world applications of Machine Learning.
Supervised learning for interpolation
For our first example, we will use supervised learning to train a model based on price information in our soufun rental listings data. We will then use the trained model to predict the prices of each cell in our analysis grid. By visualizing these predicted prices, we will get a good representation of how prices are spread geographically in our study area.
This practice of constructing new data points within the range of a discrete set of known data points is known as interpolation. Interpolation basically tries to create a continuous model for how a certain value is distributed through space. If the distribution is in two dimensions and the value is thought to be the 3rd dimension, you can think of interpolation as trying to fit a continuous 3d surface that matches the height of each point as best as possible. Because the model is continuous, it can rarely model the data perfectly. The goal rather is to give a good interpretation of the general structure while reducing the effect of outliers.
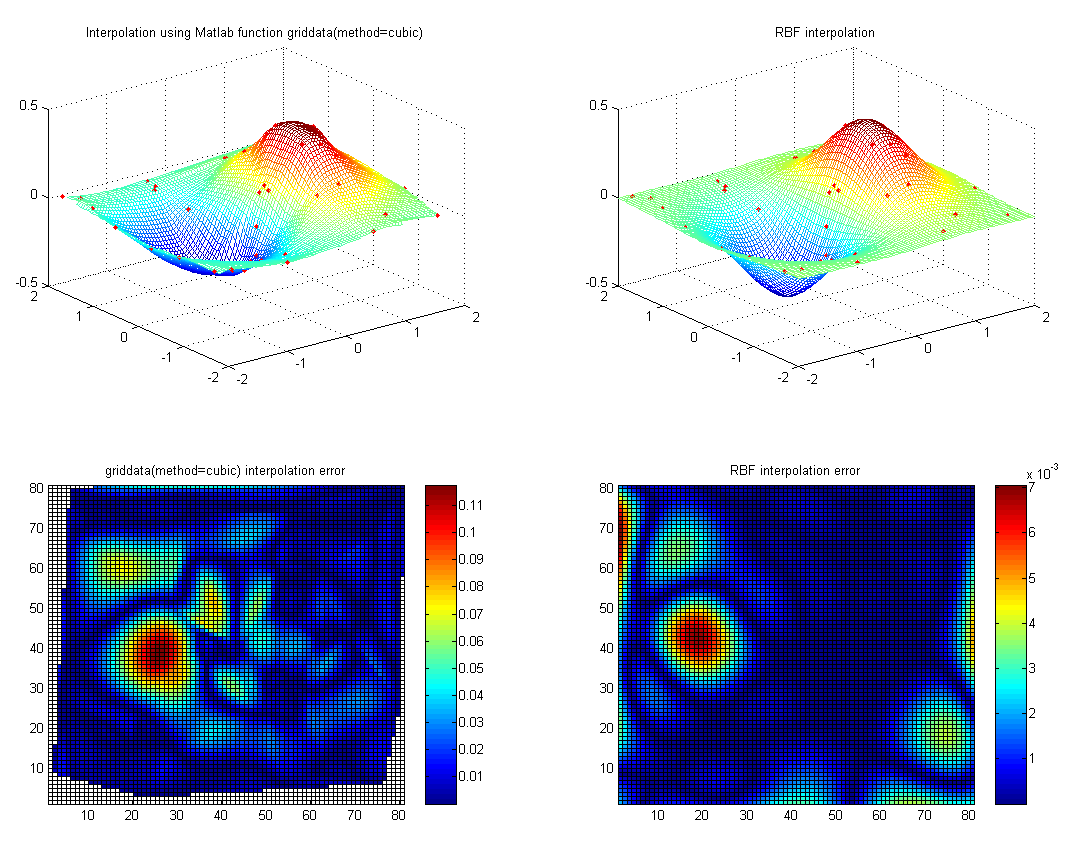
Diagram of interpolation as a fitting of a 3d continuous surface to a piece of data. The height (z-value) of the surface in this case represents the value we are trying to model. To produce the 2-d image, the z-value is represented by color [source]
Although there are many dedicated algorithms that will compute an interpolation directly, we can also use the training/prediction paradigm of supervised learning to accomplish the same goal. Although this may not be the most exciting application of Machine Learning, it will provide a simple and functional example within a low dimensional space which will introduce you to the basic functionalities of the scikit-learn library.
Scikit-learn actually supports a number of different Machine Learning algorithms, both for supervised and unsupervised learning. The documentation includes a useful flow chart which you can use to pick the proper algorithm based on the properties of your data. For each algorithm, the documentation provides a great overview, both of its practical use within the library, as well as some theoretical background on how it works.
Although you are encouraged to experiment with all the possible algorithms, for the purposes of this course we will use support vector machines (SVM), which are very practical yet powerful Machine Learning models which can be applied to a wide variety of problems. The advantage of SVM algorithms is that they are fairly intuitive in the way they work, and can be easily controlled through a small set of parameters. Another advantage is that they can be applied to both regression (predicting continuous values) and classification problems (in scikit-learn, the regression implementation of SVM is known as the SVR algorithm, while the classification implementation is known as SVC). In the next tutorial, we will use the SVR algorithm to train a supervised model on a set of known price data, with the latitude and longitude coordinates being the features of the data set, and the price being the learned value. We will then use this model to predict the price values of the latitude and longitude coordinates of the analysis grid.
Additional resources for Machine Learning
Recording of a lecture from the Fall 2014 Data Mining the City seminar describing some of the theoretical and technical background of Machine Learning
A very famous course taught by Andrew Ng, who is now a chief scientist at Baidu Research
Another great course from Caltech covering a lot more of the fundamentals of Machine Learning. Some of the math can be pretty involved, but his descriptions of the Bias/Variance tradeoff and cross validation are very good