Setting up maps with Leaflet.js
Now that we have the communication down, it is time to start building out the actual functionality of our Web Stack. After all, we are not trying to create a website that tells time, right?
The first step will be to use the Leaflet.js library to create an interactive map underlay for our client side website. Leaflet.js is a very lightweight and popular library for creating interactive web maps based on tiling technology. Tiling is a way of creating interactive, continuous, multi-scalar maps in a web browser by seamlessly joining individual image files that are requested on demand from a server as the user navigates the map. This is the technology that powers almost all modern web maps, including Google, Bing, and Baidu Maps, as well as open source versions such as Open Street Map and more in depth web mapping services such as Mapbox and CartoDB. The basic concept is that a collection of tile images at various scales are stored on a server, and a website uses dynamic code to request them as needed and present them in the correct location on the page. The Leaflet library makes this job easier by automating the process of requesting and placing the tiles, and allowing us to use any set of tiles available online.
The Leaflet.js site has a great set of very clear tutorials that you can follow to get started with its basic features. Since we want to build a full-window map application (similar to Google Maps), I will base our code on the ‘Leaflet on Mobile’ tutorial to create a simple interactive full-page map.
Switch to the 03-leaflet branch in the ‘week-3’ repository. To switch to another branch, go to your Github client and click the repository button at the top left.
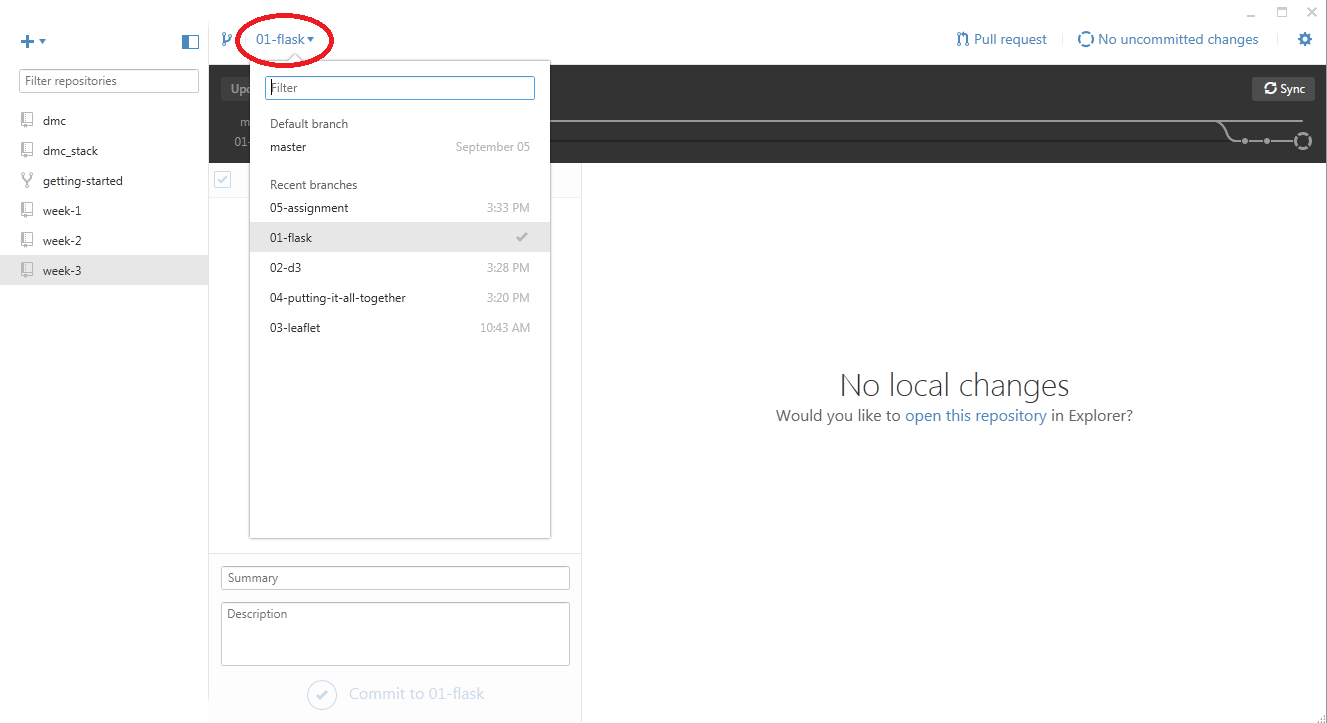
Once you switch to a different branch, your local files will automatically update to correspond to the state of that branch, and when you push commits they will be pushed to that branch as well. Make sure you commit any changes before switching branches, or you will risk losing your work.
Open the index.html file in the templates folder. This file contains a basic html web site, with d3 imported, and a <script> section in the <body> for writing code. Start by importing the Leaflet library, by adding
<script type="text/javascript" src="./static/lib/leaflet.js"></script>
withing the <head> section under the d3 import statement. In addition to the .js file, Leaflet also requires us to import a custom .css file that defines how certain features of the map is laid out. CSS is a styling language that provides a quick way for specifying the ‘look and feel’ of HTML components. This way, you do not have to specify parameters such as color, size, or font for each element in a website. Instead, you just specify those parameters globally in a CSS ‘stylesheet’, and they will apply to each element contained within a specific tag. Import the Leaflet stylesheet by typing
<link rel="stylesheet" href="./static/lib/leaflet.css"/>
on the next line. Next, we will define a few of our own styles to control how the page and the map is laid out. Like JavaScript, CSS can be either written in a separate .css file and imported, or written directly in the HTML file, as long as it is enclosed within specific tags. Unlike JavaScript, however, we include the style information within the <head> of the page. On the next few lines, type the following code:
<style>
	body {
	    padding: 0;
	    margin: 0;
	}
	html, body, #map {
	    height: 100%;
	}
</style>
The basic syntax of CSS stylesheets is pretty simple. You specify the HTML tags you want to add style information to, and enclose the style information within curly braces ‘{}’. The style information consists of a list of key/value pairs, with the property name followed by a ‘:’, followed by the value of that property. As with JavaScript, CSS does not care about spaces or line breaks, so make sure that you end each property with a ‘;’ symbol. In this code, we define some basic properties for the <body> of the page, telling it that the page should have no padding or margin. This will basically ensure that the page is full screen (you can see a good description of the different properties that control element layout, also known as the ‘box model’, here). We also specify that everything, including the whole document, the <body>, as well as any tag labeled with the ‘map’ id (remember that the ‘#’ refers to the ‘id’ property of a tag) should have a height of 100%, again ensuring that everything appears full screen.
We are almost done with the <head> section of our webpage. The last thing we need to do is add some code to tell the browser to disable unwanted scaling of the page and set it to its actual size by adding the following line at the end of <head> section, right before the </head> tag:
<meta name="viewport" content="width=device-width, initial-scale=1.0, maximum-scale=1.0, user-scalable=no" />
Now in the <body> section of the document let’s create an empty <div> container to store our map.
<div id="map"></div>
We give the container the unique id ‘map’ so that we can apply styling to it and refer to it later in the JavaScript code. Now, within the <script> </script> tags let’s use the Leaflet library to set up our basic map. The first thing we do is create a variable called ‘map’ that will store a reference to our new map.
var map = L.map('map').setView([22.399961, 114.117523], 11);
We use the .map() function of the base Leaflet class (called ‘L’) and pass it the id of the container where the map should go. In the same line, we run the .setView() function on this map to set the latitude and longitude where the map should be centered, as well as the zoom level. Executing a sequence of functions one after the other like this is known as ‘method chaining’, and is another aspect of JavaScript that may be confusing at first, but becomes very handy with practice. This is possible in JavaScript because most class methods return the modified version of the object. So you work from left to right, with each method returning the modified object, on which the next method to the right is applied. You can read a good description of method chaining in Scott Murray’s D3 tutorials.
The last thing we need to do to get our basic map working is to specify the tile files that our map will use. There are many different providers out there that serve map tiles, some which are free and others you have to pay to use. Leaflet allows you to work with any of these tile sets, so the choice is up to you and your needs. A good place to start is with OpenStreetMap tiles, which are free to use and supplied by the open source https://www.openstreetmap.org project. To bind our new map to these tiles, add the following lines of code after the ‘map’ variable definition:
L.tileLayer('http://{s}.tile.osm.org/{z}/{x}/{y}.png', {
attribution: '© <a href="http://osm.org/copyright">OpenStreetMap</a> contributors'
}).addTo(map);
This is all one line of code, broken up for readability, which first uses the .tileLayer() method of the ‘L’ Leaflet class to specify the tile set we want to use, and then uses the tile layer’s .addTo() method to add the tile layer to our map object. Into the .tileLayer() method we pass a string called the ‘URL Template’ which tells Leaflet where to locate the tiles. You can see a full documentation of the .tileLayer() function and how to format the URL Template in the Leaflet documentation. We also pass an optional ‘attribution’ parameter which specifies the source of our map tiles, and will appear at the bottom right hand corner of our map. Into the .addTo() function we pass a reference to our map object, which is stored in the ‘map’ variable.
Save the index.html file, start the app.py server, and load the page at localhost:5000. You should now see a full-page map, centered around Hong Kong, using the OpenStreetMap tiles. You can navigate around the map as you would with any online map, by clicking and dragging and using either the scroll wheel or the buttons at the upper left corner to zoom in and out.
While the basic OpenStreetMap tiles are nice, it would be great to have more control over how the map looks and have it coordinated with the rest of the graphics on our site. For this we can use a service like Mapbox, which allows us to create custom tile layers with many controls for custom styling. Mapbox includes a collection of custom styled tiles out of the box, or you can use their editing tools to create your own. You can see their basic tile sets, as well as information about how to implement them in their documentation. To use the tiles you will need to sign up for a Mapbox account and obtain an access token. To use the ‘mapbox.light’ tiles provided by Mapbox you can replace the previous tile code with
L.tileLayer('https://api.tiles.mapbox.com/v4/{mapid}/{z}/{x}/{y}.png?access_token={accessToken}', {
attribution: 'Map data © <a href="http://openstreetmap.org">OpenStreetMap</a>, Imagery © <a href="http://mapbox.com">Mapbox</a>',
mapid: 'mapbox.light',
accessToken: [INSERT YOUR TOKEN HERE!]
}).addTo(map);
Note that we have changed the URL Template string to match the one specified by Mapbox, and added a few more parameters to specify the ‘mapid’ of the tiles, as well as your individual ‘accessToken’. In order to see the tiles you will have to sign up for an account and include your own access token. You can find instructions for how to do this here. Note we also updated the map attribution to reflect that we are using data from Mapbox (this is not technically required but is a good practice and will make you feel like a good web citizen).
This concludes our basic implementation of a dynamic map underlay for our Web Stack. In the next tutorial we will put everything together by using D3 to make a request for data from the server, and displaying the data by drawing objects to the map.